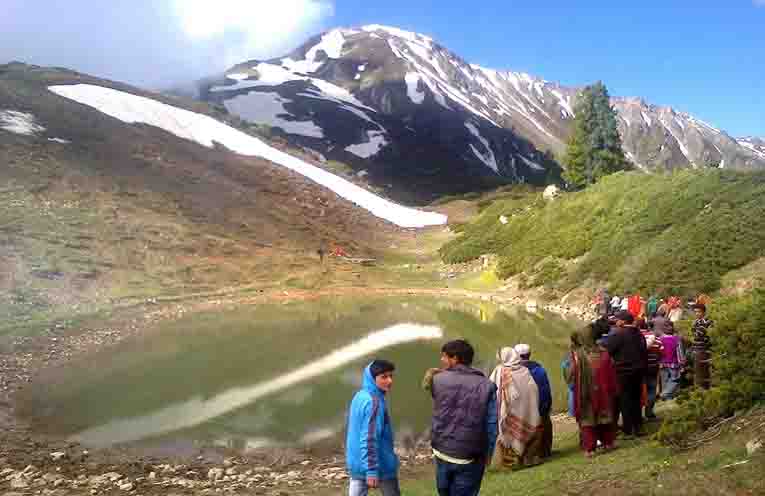
This Pargana consisted of Kwar Tenji, Bhagna, Chandna, Bhattan, Dumzi, Dajla, Chnignana, Galhar, Bhata, Piyas, Bhata Semna, Ajana, Chhichha, Sazar and Cheerji villages.
Some more information about villages under tehsil Nagseni:
1. Ajna Population – Kishtwar, Jammu and Kashmir
Ajna is a medium size village located in Kishtwar of Kishtwar district, Jammu and Kashmir with total 182 families residing. The Ajna village has population of 1125 of which 566 are males while 559 are females as per Population Census 2011.
In Ajna village population of children with age 0-6 is 302 which makes up 26.84 % of total population of village. Average Sex Ratio of Ajna village is 988 which is higher than Jammu and Kashmir state average of 889. Child Sex Ratio for the Ajna as per census is 1254, higher than Jammu and Kashmir average of 862.
Ajna village has lower literacy rate compared to Jammu and Kashmir. In 2011, literacy rate of Ajna village was 27.83 % compared to 67.16 % of Jammu and Kashmir. In Ajna Male literacy stands at 40.28 % while female literacy rate was 14.07 %.
As per constitution of India and Panchyati Raaj Act, Ajna village is administrated by Sarpanch (Head of Village) who is elected representative of village.
Ajna Data
| Particulars | Total | Male | Female |
|---|---|---|---|
| Total No. of Houses | 182 | – | – |
| Population | 1,125 | 566 | 559 |
| Child (0-6) | 302 | 134 | 168 |
| Schedule Caste | 68 | 34 | 34 |
| Schedule Tribe | 593 | 302 | 291 |
| Literacy | 27.83 % | 40.28 % | 14.07 % |
| Total Workers | 388 | 271 | 117 |
| Main Worker | 28 | 0 | 0 |
| Marginal Worker | 360 | 245 | 115 |
2. Bhatan Population – Kishtwar, Jammu and Kashmir
Bhatan is a small village located in Kishtwar of Kishtwar district, Jammu and Kashmir with total 18 families residing. The Bhatan village has population of 151 of which 76 are males while 75 are females as per Population Census 2011.
In Bhatan village population of children with age 0-6 is 30 which makes up 19.87 % of total population of village. Average Sex Ratio of Bhatan village is 987 which is higher than Jammu and Kashmir state average of 889. Child Sex Ratio for the Bhatan as per census is 1000, higher than Jammu and Kashmir average of 862.
Bhatan village has lower literacy rate compared to Jammu and Kashmir. In 2011, literacy rate of Bhatan village was 56.20 % compared to 67.16 % of Jammu and Kashmir. In Bhatan Male literacy stands at 72.13 % while female literacy rate was 40.00 %.
As per constitution of India and Panchyati Raaj Act, Bhatan village is administrated by Sarpanch (Head of Village) who is elected representative of village.
Bhatan Data
| Particulars | Total | Male | Female |
|---|---|---|---|
| Total No. of Houses | 18 | – | – |
| Population | 151 | 76 | 75 |
| Child (0-6) | 30 | 15 | 15 |
| Schedule Caste | 0 | 0 | 0 |
| Schedule Tribe | 0 | 0 | 0 |
| Literacy | 56.20 % | 72.13 % | 40.00 % |
| Total Workers | 25 | 22 | 3 |
| Main Worker | 11 | 0 | 0 |
| Marginal Worker | 14 | 12 | 2 |
3. Bhagna Population – Kishtwar, Jammu and Kashmir
Bhagna is a large village located in Kishtwar of Kishtwar district, Jammu and Kashmir with total 497 families residing. The Bhagna village has population of 2663 of which 1380 are males while 1283 are females as per Population Census 2011.
In Bhagna village population of children with age 0-6 is 469 which makes up 17.61 % of total population of village. Average Sex Ratio of Bhagna village is 930 which is higher than Jammu and Kashmir state average of 889. Child Sex Ratio for the Bhagna as per census is 914, higher than Jammu and Kashmir average of 862.
Bhagna village has lower literacy rate compared to Jammu and Kashmir. In 2011, literacy rate of Bhagna village was 57.79 % compared to 67.16 % of Jammu and Kashmir. In Bhagna Male literacy stands at 72.95 % while female literacy rate was 41.55 %.
As per constitution of India and Panchyati Raaj Act, Bhagna village is administrated by Sarpanch (Head of Village) who is elected representative of village.
Bhagna Data
| Particulars | Total | Male | Female |
|---|---|---|---|
| Total No. of Houses | 497 | – | – |
| Population | 2,663 | 1,380 | 1,283 |
| Child (0-6) | 469 | 245 | 224 |
| Schedule Caste | 158 | 77 | 81 |
| Schedule Tribe | 515 | 286 | 229 |
| Literacy | 57.79 % | 72.95 % | 41.55 % |
| Total Workers | 802 | 623 | 179 |
| Main Worker | 224 | 0 | 0 |
| Marginal Worker | 578 | 428 | 150 |
4. Chicha Nagsain Population – Kishtwar, Jammu and Kashmir
Chicha Nagsain is a medium size village located in Kishtwar of Kishtwar district, Jammu and Kashmir with total 197 families residing. The Chicha Nagsain village has population of 1125 of which 559 are males while 566 are females as per Population Census 2011.
In Chicha Nagsain village population of children with age 0-6 is 268 which makes up 23.82 % of total population of village. Average Sex Ratio of Chicha Nagsain village is 1013 which is higher than Jammu and Kashmir state average of 889. Child Sex Ratio for the Chicha as per census is 914, higher than Jammu and Kashmir average of 862.
Chichavillage has lower literacy rate compared to Jammu and Kashmir. In 2011, literacy rate of Chicha village was 27.07 % compared to 67.16 % of Jammu and Kashmir. In Chbicha Nagsain Male literacy stands at 31.74 % while female literacy rate was 22.60 %.
Chicha Nagsain Data
| Particulars | Total | Male | Female |
|---|---|---|---|
| Total No. of Houses | 197 | – | – |
| Population | 1,125 | 559 | 566 |
| Child (0-6) | 268 | 140 | 128 |
| Schedule Caste | 0 | 0 | 0 |
| Schedule Tribe | 1,118 | 555 | 563 |
| Literacy | 27.07 % | 31.74 % | 22.60 % |
| Total Workers | 259 | 249 | 10 |
| Main Worker | 24 | 0 | 0 |
| Marginal Worker | 235 | 230 | 5 |
5. Chingnana Population – Kishtwar, Jammu and Kashmir
Chingnana is a medium size village located in Kishtwar of Kishtwar district, Jammu and Kashmir with total 121 families residing. The Chingnana village has population of 685 of which 368 are males while 317 are females as per Population Census 2011.
In Chingnana village population of children with age 0-6 is 113 which makes up 16.50 % of total population of village. Average Sex Ratio of Chingnana village is 861 which is lower than Jammu and Kashmir state average of 889. Child Sex Ratio for the Chingnana as per census is 852, lower than Jammu and Kashmir average of 862.
Chingnana village has lower literacy rate compared to Jammu and Kashmir. In 2011, literacy rate of Chingnana village was 48.78 % compared to 67.16 % of Jammu and Kashmir. In Chingnana Male literacy stands at 65.15 % while female literacy rate was 29.81 %.
As per constitution of India and Panchyati Raaj Act, Chingnana village is administrated by Sarpanch (Head of Village) who is elected representative of village.
Chingnana Data
| Particulars | Total | Male | Female |
|---|---|---|---|
| Total No. of Houses | 121 | – | – |
| Population | 685 | 368 | 317 |
| Child (0-6) | 113 | 61 | 52 |
| Schedule Caste | 27 | 13 | 14 |
| Schedule Tribe | 5 | 1 | 4 |
| Literacy | 48.78 % | 65.15 % | 29.81 % |
| Total Workers | 375 | 196 | 179 |
| Main Worker | 67 | 0 | 0 |
| Marginal Worker | 308 | 156 | 152 |
6. Chandna Population – Kishtwar, Jammu and Kashmir
Chandna is a medium size village located in Kishtwar of Kishtwar district, Jammu and Kashmir with total 60 families residing. The Chandna village has population of 372 of which 201 are males while 171 are females as per Population Census 2011.
In Chandna village population of children with age 0-6 is 88 which makes up 23.66 % of total population of village. Average Sex Ratio of Chandna village is 851 which is lower than Jammu and Kashmir state average of 889. Child Sex Ratio for the Chandna as per census is 833, lower than Jammu and Kashmir average of 862.
Chandna village has lower literacy rate compared to Jammu and Kashmir. In 2011, literacy rate of Chandna village was 50.70 % compared to 67.16 % of Jammu and Kashmir. In Chandna Male literacy stands at 60.13 % while female literacy rate was 39.69 %.
As per constitution of India and Panchyati Raaj Act, Chandna village is administrated by Sarpanch (Head of Village) who is elected representative of village.
Chandna Data
| Particulars | Total | Male | Female |
|---|---|---|---|
| Total No. of Houses | 60 | – | – |
| Population | 372 | 201 | 171 |
| Child (0-6) | 88 | 48 | 40 |
| Schedule Caste | 0 | 0 | 0 |
| Schedule Tribe | 112 | 56 | 56 |
| Literacy | 50.70 % | 60.13 % | 39.69 % |
| Total Workers | 115 | 90 | 25 |
| Main Worker | 112 | 0 | 0 |
| Marginal Worker | 3 | 3 | 0 |
7. Dachla Population – Kishtwar, Jammu and Kashmir
Dachla is a medium size village located in Kishtwar of Kishtwar district, Jammu and Kashmir with total 122 families residing. The Dachla village has population of 734 of which 352 are males while 382 are females as per Population Census 2011.
In Dachla village population of children with age 0-6 is 150 which makes up 20.44 % of total population of village. Average Sex Ratio of Dachla village is 1085 which is higher than Jammu and Kashmir state average of 889. Child Sex Ratio for the Dachla as per census is 1206, higher than Jammu and Kashmir average of 862.
Dachla village has lower literacy rate compared to Jammu and Kashmir. In 2011, literacy rate of Dachla village was 23.29 % compared to 67.16 % of Jammu and Kashmir. In Dachla Male literacy stands at 31.69 % while female literacy rate was 15.33 %.
As per constitution of India and Panchyati Raaj Act, Dachla village is administrated by Sarpanch (Head of Village) who is elected representative of village.
Dachla Data
| Particulars | Total | Male | Female |
|---|---|---|---|
| Total No. of Houses | 122 | – | – |
| Population | 734 | 352 | 382 |
| Child (0-6) | 150 | 68 | 82 |
| Schedule Caste | 0 | 0 | 0 |
| Schedule Tribe | 267 | 110 | 157 |
| Literacy | 23.29 % | 31.69 % | 15.33 % |
| Total Workers | 191 | 177 | 14 |
| Main Worker | 19 | 0 | 0 |
| Marginal Worker | 172 | 162 | 10 |
8. Damji Population – Kishtwar, Jammu and Kashmir
Damji is a medium size village located in Kishtwar of Kishtwar district, Jammu and Kashmir with total 54 families residing. The Damji village has population of 360 of which 194 are males while 166 are females as per Population Census 2011.
In Damji village population of children with age 0-6 is 39 which makes up 10.83 % of total population of village. Average Sex Ratio of Damji village is 856 which is lower than Jammu and Kashmir state average of 889. Child Sex Ratio for the Damji as per census is 1167, higher than Jammu and Kashmir average of 862.
Damji village has lower literacy rate compared to Jammu and Kashmir. In 2011, literacy rate of Damji village was 50.47 % compared to 67.16 % of Jammu and Kashmir. In Damji Male literacy stands at 63.64 % while female literacy rate was 34.48 %.
As per constitution of India and Panchyati Raaj Act, Damji village is administrated by Sarpanch (Head of Village) who is elected representative of village.
Damji Data
| Particulars | Total | Male | Female |
|---|---|---|---|
| Total No. of Houses | 54 | – | – |
| Population | 360 | 194 | 166 |
| Child (0-6) | 39 | 18 | 21 |
| Schedule Caste | 0 | 0 | 0 |
| Schedule Tribe | 0 | 0 | 0 |
| Literacy | 50.47 % | 63.64 % | 34.48 % |
| Total Workers | 89 | 76 | 13 |
| Main Worker | 32 | 0 | 0 |
| Marginal Worker | 57 | 47 | 10 |
9. Galhar Bhata Population – Kishtwar, Jammu and Kashmir
Galhar Bhata is a medium size village located in Kishtwar of Kishtwar district, Jammu and Kashmir with total 292 families residing. The Galhar Bhata village has population of 1644 of which 851 are males while 793 are females as per Population Census 2011.
In Galhar Bhata village population of children with age 0-6 is 361 which makes up 21.96 % of total population of village. Average Sex Ratio of Galhar Bhata village is 932 which is higher than Jammu and Kashmir state average of 889. Child Sex Ratio for the Galhar Bhata as per census is 920, higher than Jammu and Kashmir average of 862.
Galhar Bhata village has lower literacy rate compared to Jammu and Kashmir. In 2011, literacy rate of Galhar Bhata village was 49.73 % compared to 67.16 % of Jammu and Kashmir. In Galhar Bhata Male literacy stands at 61.09 % while female literacy rate was 37.58 %.
As per constitution of India and Panchyati Raaj Act, Galhar Bhata village is administrated by Sarpanch (Head of Village) who is elected representative of village.
Galhar Bhata Data
| Particulars | Total | Male | Female |
|---|---|---|---|
| Total No. of Houses | 292 | – | – |
| Population | 1,644 | 851 | 793 |
| Child (0-6) | 361 | 188 | 173 |
| Schedule Caste | 0 | 0 | 0 |
| Schedule Tribe | 387 | 194 | 193 |
| Literacy | 49.73 % | 61.09 % | 37.58 % |
| Total Workers | 785 | 411 | 374 |
| Main Worker | 87 | 0 | 0 |
| Marginal Worker | 698 | 341 | 357 |
10. Piyas Population – Kishtwar, Jammu and Kashmir
Piyas is a medium size village located in Kishtwar of Kishtwar district, Jammu and Kashmir with total 119 families residing. The Piyas village has population of 628 of which 328 are males while 300 are females as per Population Census 2011.
In Piyas village population of children with age 0-6 is 149 which makes up 23.73 % of total population of village. Average Sex Ratio of Piyas village is 915 which is higher than Jammu and Kashmir state average of 889. Child Sex Ratio for the Piyas as per census is 1129, higher than Jammu and Kashmir average of 862.
Piyas village has lower literacy rate compared to Jammu and Kashmir. In 2011, literacy rate of Piyas village was 11.06 % compared to 67.16 % of Jammu and Kashmir. In Piyas Male literacy stands at 17.05 % while female literacy rate was 4.07 %.
As per constitution of India and Panchyati Raaj Act, Piyas village is administrated by Sarpanch (Head of Village) who is elected representative of village.
Piyas Data
| Particulars | Total | Male | Female |
|---|---|---|---|
| Total No. of Houses | 119 | – | – |
| Population | 628 | 328 | 300 |
| Child (0-6) | 149 | 70 | 79 |
| Schedule Caste | 0 | 0 | 0 |
| Schedule Tribe | 613 | 321 | 292 |
| Literacy | 11.06 % | 17.05 % | 4.07 % |
| Total Workers | 148 | 142 | 6 |
| Main Worker | 2 | 0 | 0 |
| Marginal Worker | 146 | 141 | 5 |
11. Samna Bhata Population – Kishtwar, Jammu and Kashmir
Samna Bhata is a medium size village located in Kishtwar of Kishtwar district, Jammu and Kashmir with total 212 families residing. The Samna Bhata village has population of 1183 of which 637 are males while 546 are females as per Population Census 2011.
In Samna Bhata village population of children with age 0-6 is 229 which makes up 19.36 % of total population of village. Average Sex Ratio of Samna Bhata village is 857 which is lower than Jammu and Kashmir state average of 889. Child Sex Ratio for the Samna Bhata as per census is 924, higher than Jammu and Kashmir average of 862.
Samna Bhata village has lower literacy rate compared to Jammu and Kashmir. In 2011, literacy rate of Samna Bhata village was 33.44 % compared to 67.16 % of Jammu and Kashmir. In Samna Bhata Male literacy stands at 47.88 % while female literacy rate was 16.28 %.
As per constitution of India and Panchyati Raaj Act, Samna Bhata village is administrated by Sarpanch (Head of Village) who is elected representative of village.
Samna Bhata Data
| Particulars | Total | Male | Female |
|---|---|---|---|
| Total No. of Houses | 212 | – | – |
| Population | 1,183 | 637 | 546 |
| Child (0-6) | 229 | 119 | 110 |
| Schedule Caste | 0 | 0 | 0 |
| Schedule Tribe | 547 | 294 | 253 |
| Literacy | 33.44 % | 47.88 % | 16.28 % |
| Total Workers | 314 | 303 | 11 |
| Main Worker | 43 | 0 | 0 |
| Marginal Worker | 271 | 263 | 8 |
* All Information provided as per Census 2011
*Report by Census2011.co.in
Don’t you think that you are making fun of sex ratios of each village as u are camparing it with state just think before u mention such things.
Dear Ranjeet Singh Brother,
Fun in which sense ?
this information is already on public domain and i just shared this for information. Also depends on one’s thinking.
For you it may be Fun but for me it is just information collected from Census 2011.
Thanks for Your Feedback