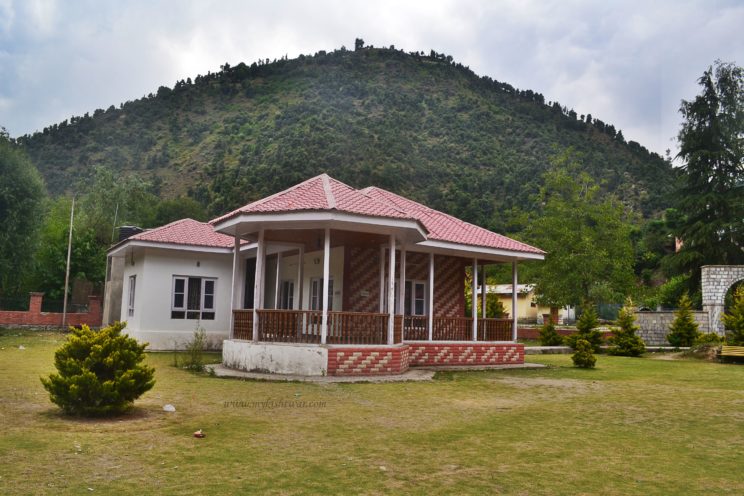
“Eight kilometres ahead of Bhandaroot comes Mughal Maidan — a scenic spot on the bank of the Chatroo River where the market place, tourist hut, and trout fish farm with crystal-clear mountain water all add to the beauty of this place. It is the green gateway to Kishtwar’s most spectacular highland destinations.”
— District Kishtwar Official Tourism, Government of J&K
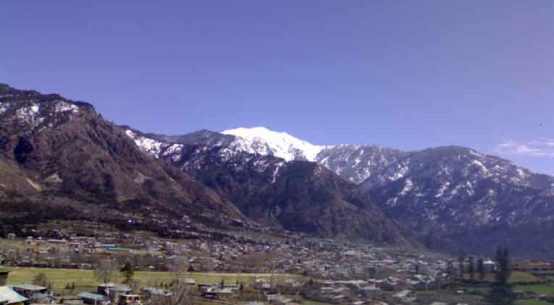
Tehsil Mughal Maidan is one of the most picturesque tehsils of District Kishtwar and forms an integral part of the Chatroo (Chhatroo) Sub-Division in the Chenab Valley region of Jammu and Kashmir. Located amidst lush green mountains, forests, rivers, and alpine landscapes on the right bank of the Chatroo River, Mughal Maidan is renowned for its natural beauty, pleasant climate, deep historical significance, and immense tourism potential.
The tehsil serves as an important administrative and commercial centre for the surrounding villages and acts as a critical gateway to several scenic destinations in the upper reaches of Kishtwar — including Chatroo, Sinthan Top, and the Singhpora Pass trekking corridor. Mughal Maidan is listed among the major tourist attractions of Kishtwar district by the official District Administration, alongside Sinthan Top, the Sapphire Mines at Paddar, Machail Valley, and Dachhan Valley.
Historical Significance — The Mughal Legacy
Mughal Maidan is historically notable as a site where the Mughals reportedly fought a battle against Kishtwar’s rulers while advancing via the Sinthan and Singhpora passes. The area has a legacy associated with the Mughal period, lending it historical and cultural importance.
Earlier it was known as Mughal Mazar — because of the burial place (graveyard) of Mughal soldiers who fell in battle here. The market place, tourist hut, and trout fish farm with crystal-clear water of the river all add to the beauty of this place. The name “Mughal Maidan” — meaning “Mughal Battlefield/Field” — grew from this association, replacing the earlier name Mughal Mazar over the centuries. Today the name carries forward this rich historical identity while the town itself has grown into a thriving mountain market and tourist transit point.
Kishtwar is connected to Srinagar by a historic trekking route which goes through Banderkot, Dadhpeth, Mughal Maidan, Chhatru, Sinthan, and Daksum — placing Mughal Maidan at the very heart of this ancient trans-Himalayan corridor that has connected the Chenab Valley with the Kashmir Valley for centuries.
Mughal Maidan — Historical Timeline
- Mughal Era: Site of a battle between Mughal forces and Kishtwar rulers advancing via Sinthan and Singhpora passes
- Original Name: Mughal Mazar — burial ground (graveyard) of Mughal soldiers who fell in this battle
- Ancient Trade Route: The historic trekking route Kishtwar → Banderkot → Mughal Maidan → Chatroo → Sinthan → Daksum → Srinagar served as a primary trans-Himalayan corridor for centuries
- Tourism Development: Identified by the Government of J&K as an emerging tourist destination; tourist hut and trout fish farm established here
- 2011 Census: Population of 25,827 across 5,773 households, encompassing 15 Panchayats
Mughal Maidan is listed as one of the popular sightseeing destinations in Kishtwar alongside Qilla Kishtwar, Katarsamna, Bharnoin, Padyarna (a historical site dotted with ruins of stone temples, stone inscriptions, and idols), and the Machail Mata temple. This places it firmly in the cultural and heritage tourism circuit of Kishtwar district.
Geographical Location & Administrative Profile
Mughal Maidan is situated about 22 kilometres from the town of Kishtwar and lies on the banks of the Chatroo River. It is located at an elevation of approximately 1,500 metres (4,921 feet) above sea level. The tehsil lies in the mountainous terrain of the Chenab Valley, surrounded by dense forests, rolling meadows, and towering Himalayan peaks.
District: Kishtwar |
Sub-Division: Chatroo (Chhatroo) |
Region: Chenab Valley |
UT: Jammu & Kashmir
Coordinates: 33°23′42″ N, 75°39′45″ E |
Elevation: ~1,500 m (4,921 ft) |
Panchayats: 15 |
Population (2011): 25,827
Borders & Boundaries
Higher Himalayan ranges towards Kashmir Valley
Interior regions of Chatroo Sub-Division
Lower mountainous areas of District Kishtwar
Kishtwar Town and adjoining valleys
Weather & Climate
Mughal Maidan enjoys a pleasant temperate mountain climate throughout most of the year, making it one of the more accessible Himalayan destinations in Kishtwar. Its elevation of ~1,500 m gives it milder winters than the higher tehsils of Chatroo and Marwah, while summers remain refreshingly cool — ideal for outdoor tourism. The best time to visit is May to September.
Tourist Places & Attractions
Mughal Maidan holds a unique position in the Kishtwar tourism landscape — it is both a destination in its own right and the key transit and launch point for several of the most spectacular destinations in the upper Chatroo highlands. The place is being developed as a tourist spot by the Government of J&K, with the Fisheries Department establishing a Fish Hatchery here.
🌿 Mughal Maidan Valley
A scenic spot on the bank of the Chatroo River. The market place and government buildings add to the beauty of this place. The valley offers magnificent scenery — forests, green meadows, mountain streams, and beautiful landscapes — and has been identified by the Government of J&K as an emerging tourist destination with a tourist hut and fish farm already in operation.
🍽️ Chatroo River & Trout Fish Farm
The Chatroo River is known for rearing Trout fish. The Fisheries Department of Jammu and Kashmir established a Fish Hatchery here. Fish trade, if promoted, will raise the economic standard of the people. The crystal-clear waters of the Chatroo River make it one of the most scenic and commercially promising trout rivers in the entire Chenab Valley region.
🏔️ Singhpora Pass Trek
Mughal Maidan serves as the starting point for a scenic trek to the Kashmir Valley via the Singhpora Pass, which culminates at Vailo near Kokernag. The trek passes through mountainous terrain, reaching a height of 11,570 feet (3,527 metres). This historic route through dense Himalayan forests and high-altitude passes is prized by experienced trekkers.
🏕️ Forests, Meadows & Camping
The surrounding deodar, pine, and fir forests and alpine grasslands offer ideal opportunities for nature walks, camping, birdwatching, landscape photography, and eco-tourism activities. The meadows alongside the Chatroo River are particularly popular for overnight camping during summer months.
🏗 Gateway to Sinthan Top & Chatroo
Mughal Maidan is a critical waypoint on the Kishtwar–Sinthan Top–Anantnag circuit — widely regarded as one of the most beautiful tourist circuits in India. Travellers heading to Chatroo, Sinthan Maidan, Chingam, Mughal Maidan meadows, and onward to Anantnag all pass through or stop at Mughal Maidan.
🍎 Walnut Orchards & Natural Produce
The area is rich in scenic beauty and is famous for its natural resources like walnuts, apples, rajmah, and guchi (morel mushrooms). In Marwah, Chatroo, Mughal Maidan, and Bounjwah tehsils, walnut production of the best quality — in thousands of tons — is recorded annually. These world-class walnuts form an important part of the local agricultural economy.
Agriculture, Economy & Livelihood
Agriculture remains the backbone of the local economy in Tehsil Mughal Maidan. The tehsil’s lower elevation (compared to Marwah and Warwan) allows a broader range of crops than the high-altitude valleys — including wheat, paddy, maize, and vegetables. In Marwah, Chatroo, Mughal Maidan, and Bounjwah tehsils, walnut production of the best quality in thousands of tons is recorded annually — making this one of the finest walnut-producing belts in Jammu and Kashmir.
Key Economic Activities of Tehsil Mughal Maidan
- Paddy and maize cultivation in the river valley terraces
- Wheat and vegetable production in suitable areas
- World-class walnut production — thousands of tons annually (best quality in Kishtwar)
- Apple orchards and fruit cultivation
- Guchi (morel mushroom) collection — a high-value rare forest product
- Rajmah (kidney beans) — an important cash crop
- Livestock rearing and dairy farming
- Trout fish farming on the Chatroo River — government Fish Hatchery established
- Small-scale trade, government services, and emerging eco-tourism activities
Culture, Heritage & Community Life
The people of Mughal Maidan are known for their simplicity, warm hospitality, and rich cultural traditions rooted in the broader Chenab Valley mountain culture. The tehsil sits at the crossroads of the Kishtwar and Chatroo cultural zones — influenced by Kishtwari folk traditions, mountain agriculture practices, and the linguistic blending that characterises this part of the Chenab Valley.
Kashmiri, Urdu, and Kishtwari dialects are spoken across the tehsil. Traditional mountain architecture — with wooden construction adapted to heavy winter snowfall — is visible in the older village settlements. Community-based social life, traditional cuisine, agricultural festivals, and a deep reverence for the land and its natural resources define the cultural character of Mughal Maidan’s people.
The largest village in Tehsil Mughal Maidan by population is Sigdee — with 5,807 people in 1,370 households. Sigdee has a substantial Schedule Tribe (ST) population of 2,221 people (38.25% of the village total), making it one of the most tribally significant settlements in the Chatroo Sub-Division. The second largest village, Kuchal, has 4,688 residents and the tehsil’s most active cultivator workforce, with 663 cultivators recorded among its main workers.
Village-wise Census Data — Tehsil Mughal Maidan (2011)
The table below presents complete village-wise demographic data from the Census of India 2011 for all nine recorded villages of Tehsil Mughal Maidan, covering population, sex ratio, literacy rates, and scheduled caste/tribe composition.
Connectivity & How to Reach
Mughal Maidan enjoys relatively better connectivity compared to the higher-altitude tehsils of Kishtwar district. It is accessible by motorable road and serves as a critical transit hub on the Kishtwar–Chatroo–Sinthan Top–Anantnag corridor.
Why Tehsil Mughal Maidan Is Special
Top Reasons to Explore Mughal Maidan, Kishtwar
- Historic Mughal Battlefield: Former Mughal Mazar — one of the few named Mughal battle sites in the Chenab Valley
- Singhpora Pass Trek (3,527 m): A superb mountain trek from Mughal Maidan to Vailo near Kokernag, Kashmir Valley
- Chatroo River Trout: Government-established fish hatchery and one of the finest trout rivers in the Chenab Valley
- World-class Walnuts: Among the finest quality walnut producing areas in all of Kishtwar — thousands of tons annually
- Gateway to Sinthan Top: Transit hub on India’s most scenic tourist circuit — Kishtwar–Chatroo–Sinthan–Daksum–Anantnag
- Dense deodar, pine, and fir forests ideal for nature walks, camping, and birdwatching
- Pleasant temperate climate — accessible for most of the year compared to higher mountain tehsils
- Government tourist hut and facilities already established — better prepared for visitors than many Kishtwar sub-divisions
- Registered J&K Film Development Council filming location — recognised for cinematic potential
The ancient trekking route connecting Kishtwar to Srinagar — one of the oldest trans-Himalayan crossings in the Chenab Valley — passed directly through Mughal Maidan, making it a historic waypoint on journeys that shaped the region’s cultural and political history for centuries. The route: Kishtwar → Banderkot → Dadhpeth → Mughal Maidan → Chatroo → Sinthan Top → Daksum → Srinagar. Today this same corridor forms NH 244 — one of India’s most scenically spectacular national highway segments.
Related Tags
Mughal Maidan Kishtwar
Chatroo River Trout
Singhpora Pass Trek
Sigdee Village Kishtwar
Kuchal Village
Darbeel Kishtwar
Rahalthal Village
Mughal History J&K
Walnut Production Kishtwar
Kishtwar Tourism
NH 244 Kishtwar
Chenab Valley J&K
Mughal Mazar Kishtwar
Related Topics on mykishtwar.com
Sinthan Top Travel Guide
Tehsil Marwah
Kishtwar National Park
Adventure Tourism Kishtwar
Tourist Circuits Kishtwar
History of Kishtwar
How to Reach Kishtwar
| Established 2011 | Kishtwar District, Jammu & Kashmir, India
| contact@mykishtwar.com
| +91-7006607991
[embedyt] https://www.youtube.com/watch?v=MRfuIBHBpiM[/embedyt]

One thought on “Tehsil Mughal Maidan”