“Tucked deep inside the rugged embrace of the Great Himalayas, Tehsil Marwah is a place where time slows down — where ancient rock engravings whisper of lost civilisations, the Marusudar River hums through wide alluvial meadows, and forests alive with snow leopards and musk deer stretch to the edge of Zanskar. This is Kishtwar’s most pristine valley — an untouched paradise waiting to be discovered.”
Tehsil Marwah is one of the most beautiful and remote tehsils of the Chatroo Sub-Division in Kishtwar District, Jammu and Kashmir. Nestled amidst the mighty inner Himalayas and drained by the magnificent Marusudar River — the largest tributary of the Chenab — Marwah is renowned for its breathtaking alpine landscapes, lush green meadows, dense coniferous forests, snow-covered mountain peaks, and pristine glacier-fed rivers.
Often described as one of the hidden gems of the Chenab Valley, Marwah remains largely untouched by commercial tourism and offers visitors an experience of nature in its purest form. During the 1980s and early 1990s, Marwah Valley was a hotspot for trekkers from across India and Europe, who followed the classic high-mountain trail: Yourdoo → Methwan → Mundeksar → Panikhar (Kargil). Today, the valley is once again emerging as one of the finest trekking destinations in Jammu and Kashmir.
Geographical Location & Terrain
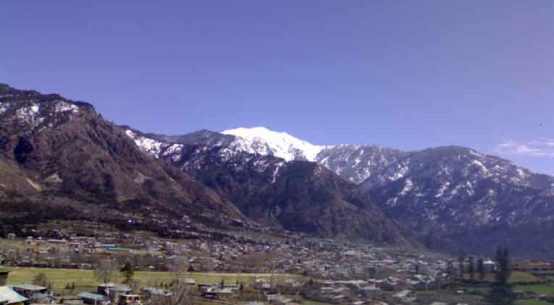
Tehsil Marwah lies in the north-western mountainous zone of District Kishtwar, hugging the eastern alpine boundaries of the Kashmir Valley and the southern edges of Ladakh. The tehsil is centered approximately at latitude 33°49′ N and longitude 75°55′ E. The main valley floor sits at an altitude ranging between 2,000 to 2,200 metres (6,500 to 7,200 feet) above sea level, while the surrounding snow-capped peaks exceed 4,500 metres.
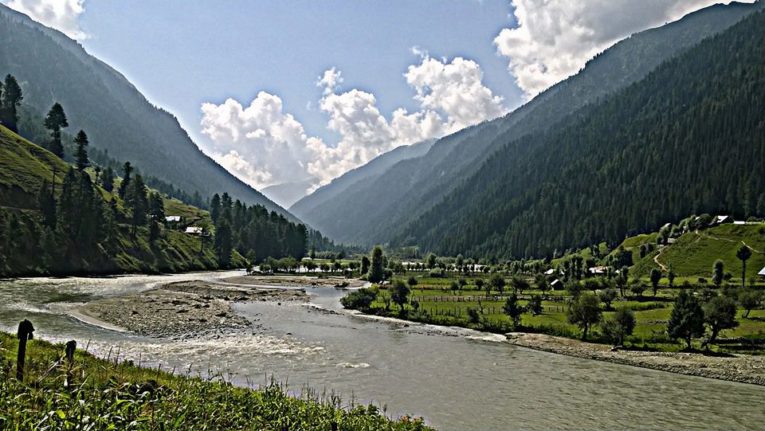
The entire terrain is shaped and drained by the Marusudar River (locally known as the Mariv Sudir) — the largest tributary of the Chenab River. It snakes through the center of Marwah, carving wide, fertile alluvial plains that support local settlements before charging south through deep, narrow gorges towards the Chenab Valley below.
The tehsil covers approximately 307 square kilometres and is separated from the outside world by high mountain ridges passable only through seasonal foot trails and mountain passes — most notably the Margan Top (3,670 m) — which links Marwah to Kokernag in Anantnag district. The 100 km long Marwah–Warwan–Margan Top–Matigawran Road, thrown open in 2007 and connecting to Kokernag in south Kashmir’s Anantnag district, remains the only surface link to the outside world.
Borders & Boundaries
Warwan Valley
Zanskar & Ladakh Mountain Ranges
Dachhan & Kishtwar Tehsils
Anantnag District, Kashmir Valley
Elevation: 2,000–2,200 m (valley floor), peaks >4,500 m |
Area: ~307 km² |
Tehsil HQ: Nowpachi |
Sub-Division: Chatroo Sub-Division, Kishtwar
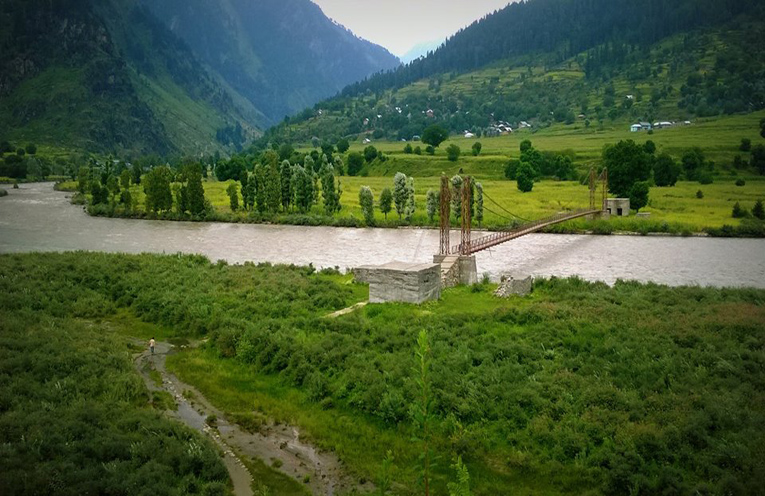
The Marusudar River — Lifeline of Marwah
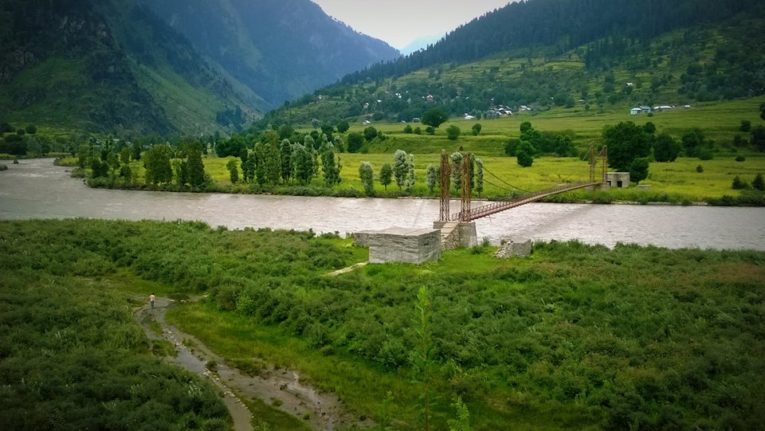
The soul of Tehsil Marwah is the Marusudar River (locally celebrated as the Mariv Sudir), the largest tributary of the mighty Chenab River. As it flows through the heart of Marwah, the Marusudar carves wide, fertile alluvial plains past the valley’s principal settlements — Hanzal, Tiller, Chanjer, Nowpachi, Astaangam, Yeerdu, and Qaderna — before turning south through deep mountain gorges.
The Marusudar provides critical irrigation facilities to farmers, enabling the cultivation of maize and local varieties of paddy. The land is not suited for wheat or modern paddy varieties due to its high altitude and cold climate. Beyond agriculture, the river’s fast-flowing, glacier-fed waters offer outstanding potential for water rafting, water skiing, angling, and kayaking — water sports for which Marwah and Warwan valleys are specifically identified as ideal sites by the District Administration Kishtwar.
The Marusudar River provides facilities for water rafting and water skiing along its open stretches near Yeerdu and Nowpachi — making Marwah one of the very few places in Kishtwar district where multiple aquatic adventure activities can be enjoyed within the same valley. Foreign mountaineers and trekkers have been visiting this region for decades to scale several internationally famous Himalayan peaks accessible from the valley.
Weather & Climate of Marwah Valley
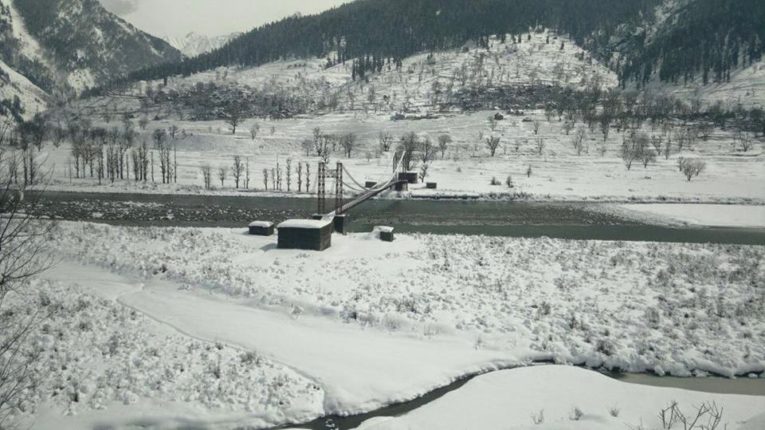
Marwah experiences a temperate to sub-alpine Himalayan climate, heavily impacted by its high elevation and the surrounding glacial mountain ranges. Winters are long and severe, while summers offer a brief but gloriously mild window that transforms the valley into a tapestry of green meadows and wildflowers. The best time to visit is May to September.
History, Heritage & Ancient Civilisation
Marwah is not merely a natural paradise — it is a valley with deep historical roots. Engravings on rocks, remains of broken idols of gods and goddesses, and Noans (ancient ritual markings) found at many locations throughout Marwah point to an ancient civilisation that flourished here and was gradually wiped away with the passage of time, leaving only these stone echoes behind.
At Astaangam village, the revered Astaan — a sacred shrine — attracts devotees from across Marwah and beyond. Here, precious relics of Hazrat Shah Farid-ud-Din Baghdadi have been preserved for centuries and are displayed to devotees on special sacred occasions, serving as a living thread connecting the valley to its deep spiritual heritage.
The valley is populated by both Hindus and Muslims in peaceful co-existence — a multi-faith community tradition that has endured through centuries of geographic isolation and has shaped the inclusive, warm cultural character of Marwah’s people.
Tourist Places & Attractions in Tehsil Marwah
Because of its relative remoteness, Marwah offers an authentic eco-tourism, trekking, and adventure experience completely free of commercial crowds. The Kishtwar–Dachhan–Marwah–Margan Top–Anantnag Tourist Circuit abounds in matchless natural beauty, forests with rich flora and fauna, meadows and pastures, and places of interest for adventurers, mountaineers, film-makers, rock climbers, and sportsmen.
♨️ Tatapani — Natural Hot Springs
Located near Rinaie village, the Tatapani hot sulfur springs are one of the most unique natural attractions in Marwah. The hot springs in Rinaie village are believed to have medicinal properties that cure rheumatic pains and skin ailments. Visitors arrive from across the valley and from Kashmir to bathe in these naturally warm mineral waters set against a stunning mountain backdrop.
🏭 Kishtwar National Park (Marwah Sector)
A substantial portion of Tehsil Marwah falls within the Kishtwar High Altitude National Park. The catchment areas of the Kiyar and Nanth streams, flowing directly into the Marusudar, lie within this critical habitat. The valley is home to Kishtwar National Park, famous for its rare wildlife including snow leopards and Himalayan brown bears. Dense coniferous forests of pine and spruce protect ibex, musk deer, and hundreds of bird species.
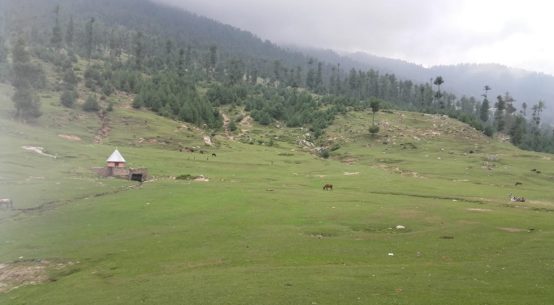
🌿 Yeerdu & Nowpachi Meadows
Nowpachi serves as the administrative headquarters of Tehsil Marwah. Together with the nearby village of Yeerdu, it boasts vast flat alpine meadows and the iconic Yeerdu Cricket Stadium — a remarkable facility at high altitude. The Mariv Sudir River flows past these plains creating an ideal setting for river rafting, angling, and camping.
🌳 Sarasnag, Mudaksar & Hajan Park
For seasoned trekkers, the high-altitude alpine lakes of Sarasnag and Mudaksar sit tucked away in the upper ridges of the tehsil, offering challenging but highly rewarding trekking routes. Hajan Park is a pine-sheltered photogenic clearing ideal for eco-travellers, picnics, and nature photography during the summer months.
🏠 Astaangam — The Sacred Astaan Shrine
The village of Astaangam is home to a revered shrine (Astaan) where the precious relics of Hazrat Shah Farid-ud-Din Baghdadi have been preserved for centuries. The shrine draws devotees from across the Marwah and Warwan regions on special sacred occasions and serves as a key spiritual centre of the valley.
⛰️ Kandinag & Yordu Doomail
Kandinag is a high-altitude meadow known for breathtaking panoramic views and rich alpine vegetation — one of the finest viewpoints in the entire tehsil. Yordu Doomail is one of the most picturesque confluences in Marwah, where rivers and streams meet amidst green alpine landscapes.
Trekking Routes & Adventure Tourism
Marwah Valley forms the centerpiece of several celebrated Trans-Himalayan trekking routes that connect the Chenab Valley with the Kashmir Valley and the Zanskar–Ladakh region. Bonjwah, Saroor, Chhatroo, Dachhan, Marwah, Warwan, and Paddar valleys of Kishtwar district have immense adventure potential. It is along these valleys that the Trans-Himalayan trekking trails lead to Zanskar valleys of Ladakh and Kargil on one side, and to the Kashmir Valley and Himachal Pradesh on the other, amidst breathtaking mountain scenery.
Major Trekking Routes Through Tehsil Marwah
- Kishtwar–Marwah–Warwan–Margan Top–Anantnag Circuit: The flagship 6-day trek through Marwah. Stages: Kishtwar → Palmer → Ikhala → Sirshi → Hanzal → Yeerdu → Inshan → Margan Top (3,670 m) → Lehinvan (Anantnag). Grade: Moderate.
- Yeerdu–Methwan–Mundeksar–Panikhar (Kargil): Classic Trans-Himalayan trail linking Marwah directly with the Kargil region of Ladakh. A legendary route for experienced mountaineers.
- Warwan–Sukhnai–Kanital–Panikhar: Takes 3–4 days from Sukhnai. A left turn leads to Sheshnag in the Pahalgam area; the route passes many pristine lakes, meadows, and dense forests.
- Marwah–Sinthan Top Circuit: From Warwan side, trekkers can reach Sinthan Top via Chatroo — a route studded with approximately 8 alpine lakes and meadows.
- Marwah–Zanskar via Kibar–Kiar Valley: Trekkers can deviate from the main Warwan trail to explore the Kiar and Kibar valley at the base of the Sickle Moon (Bhrahmah) peaks and continue into Zanskar — a route for experienced Himalayan trekkers only.
Flora, Fauna & Biodiversity
Large areas of Marwah and the adjoining Warwan Valley are covered with thick forests of pine and spruce, while deodar — though present — is comparatively rare. These forested mountain slopes represent a critical ecological zone within the Greater Himalayan ecosystem and support an extraordinary range of Himalayan wildlife. Medicinal herbs and rare herbal plants are found in abundance throughout the forests, and local communities have long collected these for livelihood and traditional medicine.
🌿 Flora of Marwah
- Pine and Spruce (dominant forest cover)
- Kail Pine (Blue Pine)
- Deodar Cedar (limited)
- Fir and Birch trees
- Alpine grasses and seasonal wildflowers
- Medicinal herbs and herbal plants (abundant)
- Walnut and Ambri Apple orchards (near settlements)
🐕 Wildlife of Marwah
- Snow Leopard (higher reaches)
- Himalayan Brown Bear
- Himalayan Black Bear
- Musk Deer
- Ibex (Kail) and Thar (Mountain Goat)
- Red Deer (Stag)
- Porcupine and other small mammals
- Himalayan Pheasants and migratory birds
Agriculture, Economy & Livelihood
The economy of Tehsil Marwah is primarily rural and rooted in its relationship with the land and the forest. The cold climate and high altitude limit agricultural productivity — the valley is deficient in food items — but its tourism potential and forest resources are immense. The Marusudar River provides irrigative facilities for growing maize and local paddy varieties; wheat and modern pulses are not well-suited to the extreme altitude.
Key Economic Activities of Tehsil Marwah
- Cultivation of maize, local paddy, amaranth, buckwheat, and other mountain crops
- Rajmash (kidney beans), walnut, and Ambri apples — exported to other parts of J&K
- Sheep and goat rearing — primary livestock activity in high-altitude areas
- Collection and sale of medicinal herbs and forest produce
- Livestock farming (horses, cows, buffaloes, goats)
- Seasonal tourism, trekking support, and eco-tourism activities
- Water sports and adventure tourism on the Marusudar River (emerging)
Marwah & Warwan — 21 Revenue Villages
Tehsil Marwah and the connected Warwan Valley together comprise 21 revenue villages spread across two distinct sub-areas — Marwah and Warwan — with a combined population of approximately 40,000 people. Remarkably, none of these villages have yet been linked by motorable road either from the Kishtwar side or the Kashmir side — a reality that underscores both the extreme remoteness and the extraordinary natural preservation of this twin-valley region.
🏠 Marwah Area Villages (10)
Yeerdu, Tiller, Chanjer, Deharna, Drarri, Rinaie (Renai), Pathgam, Qaderna, Nowpachi, Nowgam
🏠 Warwan Area Villages (11)
Arwan, Inshan, Afti, Basmana, Mulwarwan, Brayan, Choidraman, Rikanwas, Sukhnai, Margi, Gomri, Monkli
The twin valleys of Marwah and Warwan, spread over 40 villages with nearly 40,000 population, are yet to be connected to the district headquarters of Kishtwar. Villagers have to trek a 30 km treacherous mountainous stretch to reach Dachan on the Kishtwar side. A proposed tunnel from Marwah to Chatroo on the Kishtwar side would transform connectivity for these communities — but as of now, the 100 km Marwah–Margan Top–Anantnag road remains the only surface link to the outside world.
Village-wise Census Data — Tehsil Marwah (2011)
The table below provides complete village-wise demographic data from the Census of India 2011 for all recorded villages of Tehsil Marwah, covering population, sex ratio, literacy rates, and scheduled caste/tribe figures.
How to Reach Tehsil Marwah
Reaching Tehsil Marwah requires planning and a spirit of adventure. The approach from the Kishtwar side involves a road journey to Patimhala (32 km from Kishtwar) — the last bus point — followed by a vehicle transfer to Ikhala (6 km further), and then a 25 km trek along the Marusudar River to Hanzal and onward into the valley. From the Kashmir side, the seasonal Margan Top road connects Marwah to Kokernag in Anantnag.
Why Tehsil Marwah Is Truly Special
Top Reasons to Visit Marwah Valley, Kishtwar
- One of the most pristine and unexplored valleys in all of Jammu and Kashmir
- Home to Kishtwar National Park — snow leopards, brown bears, musk deer, and ibex
- Tatapani hot springs at Rinaie — natural mineral waters with therapeutic properties
- The Kishtwar–Marwah–Warwan–Margan Top–Anantnag Trek — rated among India’s finest
- Yeerdu Cricket Stadium — a remarkable high-altitude sporting venue
- Water rafting, skiing, angling, and kayaking on the Marusudar River
- Ancient rock engravings and relics pointing to a pre-historic Himalayan civilisation
- Sacred shrines — the Astaan at Astaangam (relics of Hazrat Shah Farid-ud-Din Baghdadi)
- Alpine lakes of Sarasnag and Mudaksar for high-altitude trekking
- Rich biodiversity — thick pine and spruce forests, rare medicinal herbs, and diverse bird species
The famous Himalayan mountain peaks Nun and Kun — two of the highest peaks in the Pir Panjal range — can be reached from Sukhnai village in Warwan by crossing the Lanwilla Pass. Additionally, during the 1980s and early 1990s, Marwah Valley was a hotspot for trekkers from across India and Europe, who followed the classic high-mountain trail: Yourdoo → Methwan → Mundeksar → Panikhar (Kargil). Today, the valley is once again emerging as one of the top trekking destinations in J&K.
Related Tags
Marwah Valley Kishtwar
Warwan Valley Trek
Marusudar River
Tatapani Hot Springs
Kishtwar National Park
Nowpachi Village
Margan Top Pass
Sarasnag Lake
Snow Leopard Kishtwar
Yeerdu Nowpachi
Himalayan Trekking J&K
Chenab Valley Tourism
Nun Kun Peaks
Related Topics on mykishtwar.com
Tehsil Chatroo
Tehsil Atholi (Paddar)
Adventure Tourism Kishtwar
Sinthan Top Guide
Tourist Circuits Kishtwar
Dachhan Valley
How to Reach Kishtwar
| Established 2011 | Kishtwar District, Jammu & Kashmir, India
| contact@mykishtwar.com
| +91-7006607991